
What if your most valuable source of inspiration for your next blockbuster product wasn’t in a creative brainstorming session, but was hidden deep within your customer support tickets and return logs? Most brands view warranty claims and product returns as a cost center—a financial liability to be minimized. Smart brands, however, see them as a goldmine of raw, unfiltered product feedback.
This is the essence of a truly data-driven product design process. It’s a strategic shift from designing based on assumptions to iterating based on evidence. This guide will explain how your brand can transform warranty data from a painful expense into a powerful engine for your next NPI (New Product Introduction) process, creating a virtuous product feedback loop that leads to better products, happier customers, and a stronger bottom line.
Why Warranty Data is a Goldmine for Product R&D
Before diving into the “how,” it’s critical to understand why this data is so uniquely valuable compared to other forms of customer feedback like surveys or focus groups.
- It’s Unbiased: A customer who takes the time to file a warranty claim is highly motivated. They aren’t answering a hypothetical question; they are reporting a real-world failure. This data shows what actually breaks or fails, not just what people say they dislike.
- It’s Specific: Warranty claims often contain incredibly detailed descriptions of the failure mode. “The plastic clip that holds the guard comb on snapped off.” “The battery stopped holding a full charge after six months.” This is the kind of specific, actionable feedback that engineers dream of.
- It’s Quantifiable: Unlike anecdotal feedback, warranty data allows you to track the failure rate of specific components over time. You can answer critical questions like: Is the failure rate of the motor 0.1% or 2%? Did the defect rate increase after we switched suppliers? This data is the foundation of effective Quality Assurance (QA).

The 3-Step Process for Warranty Data Analysis
Collecting the data is one thing; turning it into actionable insights is another. A systematic process is key.
Step 1: Systematize Your Data Collection You can’t analyze what you don’t track properly. The first step is to work with your customer support team to capture data in a structured way.
- Use a Tagging System: In your CRM or support software, create standardized tags for the “reason for return/claim” (e.g., “Battery Failure,” “Blade Dullness,” “Broken Attachment,” “Power Issue”).
- Capture Production Info: Whenever possible, link each claim to the product’s model, batch number, and date of manufacture. This helps you identify if a problem is widespread or isolated to a specific production run.
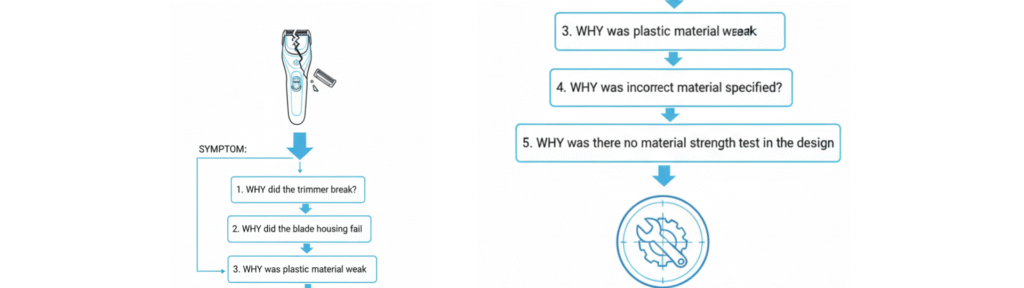
Step 2: Perform Root Cause Analysis (RCA) This is the core investigative task. For every major category of failure, you need to dig deep to find the true root cause, not just the symptom. A simple but powerful method is the “5 Whys” technique.
- Example:
- Problem: The trimmer is pulling hair (based on customer complaints).
- Why? The blade became dull very quickly.
- Why? The steel used had poor edge retention.
- Why? We sourced a cheaper grade of steel to lower costs.
- Why? Our initial product spec didn’t prioritize long-term sharpness. This reveals the root cause was a strategic decision, not just a random failure.
Step 3: Quantify and Prioritize Once you know the root causes, you need to decide which problems to tackle first. A simple priority matrix can help:
- High Frequency, High Severity: (e.g., 5% of units have battery failures that make the product unusable). This is a crisis. Fix it immediately.
- High Frequency, Low Severity: (e.g., 10% of units have a logo that rubs off after 6 months). This is not critical, but it damages your brand’s perception of quality. Schedule a fix for the next major design update.
- Low Frequency, High Severity: (e.g., a very rare but serious overheating issue). This requires immediate investigation, even if it only affects a tiny number of units.
- Low Frequency, Low Severity: (e.g., a rare cosmetic blemish). Monitor the data, but it’s a lower priority.
From Data to Design: Translating Insights into Action

This is where the product feedback loop closes. The insights from your analysis must be translated into concrete engineering and design changes for your next product version.
| Warranty Data Insight (The “Failure”) | Flawed V1 Design Feature | Data-Driven V2 Design Improvement (The “Feature”) |
| “25% of all claims are for broken guard comb clips.” | A thin, brittle ABS plastic clip on the attachment. | Redesigned clip using a more flexible and durable PC+ABS polymer blend with a reinforced structure. |
| “18% of claims: ‘The battery died after only 8 months.'” | Used a standard battery cell rated for only 300 charge cycles. | Upgraded to a premium battery cell rated for 500+ cycles. Added a smarter charging circuit to prolong battery health. |
| “12% of claims: ‘It stopped working after I dropped it in the sink.'” | Marketed as “water-resistant” but lacked robust internal seals. | Upgraded the design to a true IPX7 waterproof rating with precision silicone gaskets. |
| “9% of customer complaints mention the motor is too loud.” | Used a standard, low-cost brushed motor. | Upgraded to a quieter, smoother brushless motor and added internal vibration dampening. |

Conclusion: Your Angry Customers Are Your Best Consultants
Your warranty and returns data is not a cost center; it is a strategic asset waiting to be mined. It provides an unfiltered, direct line to your product’s real-world weaknesses and your customers’ biggest frustrations.
A truly data-driven product design process doesn’t start with a blank page in a design studio; it starts by systematically listening to the Voice of the Customer (VoC) found in the data from your last product’s failures. By creating a robust product feedback loop—collecting, analyzing, and acting on this information—you can build a roadmap for continuous improvement that will consistently delight your customers, reduce long-term costs, and leave your competitors wondering how you build such reliable products.